(This essay was published in Hong Kong Economic Journal on 21 June 2017.)
How has Hong Kong’s economy performed in the twenty years since the establishment of the Special Administrative Region? Compared to the previous twenty years, economic growth has certainly slowed and economic inequality has increased.
Average annual growth rates of GDP and GDP per capita increased, respectively, by 6.6 and 4.8 per cent in the period 1977-1997 but 3.2 and 2.6 per cent in 1997-2017.
Among households with heads between aged 20 and 65 years old, the Gini-coefficients on the distribution of household income (before government transfer subsidies) increased from 0.432 in 1976, to 0.477 in 1996 and 0.507 in 2016. To avoid artificially distorting the measured Gini coefficient, I have excluded households with heads over 65 years old because these are mostly retired and without income.
The changes in growth and inequality are fairly large between the two periods. Why have these figures worsened by so much? And how should we judge this economic performance?
I have come across several popular explanations for our relatively poor economic performance since 1997 compared to the two decades before then.
First, some claim the more recent period experienced the detrimental effects of the Asian Financial Crisis and the Global Financial Tsunami, while the earlier period benefited from structural economic transformation due to China’s economic opening. But these factors cannot explain why Hong Kong has not performed as well as Singapore in the past twenty years since both economies have faced the same external challenges.
Second, some claim the continued adherence to ‘positive non-interventionism’ as the policy guideline for conducting economic policy is outdated. But it is not clear to me whether it is due more to the adherence to such a policy as opposed to fewer adherences that might be contributing to the lower efficiency and rising inequality.
Before 1997, the government paid Hong Kong Telecom and purchased back its franchise on telecommunications in order to open up the market. Nowadays we put up hurdles to make it difficult for Uber, Airbnb, medical doctors and all sorts of businesses and skilled workers to operate in Hong Kong. Visitors from the Mainland scoff at the backwardness of our financial technology in Hong Kong. In so many areas regulatory barriers have held back innovation and competition; and in some cases worsened equality. The track record of the past twenty years is far from clear-cut.
Third, the finger has been pointed at the rapid structural transformation of Hong Kong’s economy from export-oriented manufacturing to services, following China’s opening in 1979. Since both consumer and producer services are often more regulated than export oriented goods industries, therefore, by default the Hong Kong economy has become less free, competitive, and efficient.
Fourth, some argue the rising cost of development due to regulatory costs has led to a severe shortage of property and housing that has slowed growth. Rising rents and property prices have also contributed to greater economic inequality, especially in propertied wealth, and the cost of doing business at a time when rising prosperity throughout Asia has fueled the demand for office space and domestic housing in Hong Kong.
In principle, some of these factors are not without merit, but it is not always easy to demonstrate empirically if their cumulative effects can account for Hong Kong’s poor economic performance. Every industry, no matter how large, is still a small part of the overall economy so the negative impact is often greatly exaggerated.
When I was a student of Professor Robert Fogel’s economic history course on strategic factors in American economic growth. I learned to appreciate that even as important a factor as railroads had a modest impact. He estimated that if the U.S. had not built railroads – considered by most economic historians to be the engine of American growth – the economy would only have grown slower by at most one-quarter of one per cent. And the reason is simple: there were always less perfect substitutes for railroads, implying the future would not be as bleak as imagined.
If a primary cause for Hong Kong’s economic slowdown and increasing inequality could be found then, it is likely to be the changes in population and labor. Labor employment accounts for one-half to two-thirds of GDP in most rich economies. Gini-coefficients in most countries measure only labor incomes in a household because other sources of income are often missing or under reported; hence, observed economic inequality is mostly due to labor market income.
Hong Kong’s poor economic performance in the past twenty years has its origins in the population structure it inherited from the immediate postwar years. In the period from 1945 to 1948, the population of Hong Kong increased from 600,000 to 1.8 million as a result of the influx of immigrants from the Mainland. Another 500,000 arrived between 1948 and 1951 and Hong Kong’s population increased to 2.3 million.
These influxes probably shaped the future course of Hong Kong’s economy up to the present time more than any other factor. They created waves of population surge and collapse by age cohorts.
The adult generation that arrived after the war from 1945 to 1951 was the largest cohort and they gave birth to an unusually large baby boom generation because they wanted large families. The baby boom generation that reached family formation age in the 1970s wanted small families. The third generation delayed marriage and wanted even smaller families so they only reached family formation age in the 2000s.
As a consequence, the number of children born in different age cohorts has changed dramatically. The number of children born in the 1950s was by far the highest among all postwar cohorts; but fewer were born in the 1970s and fewer still in the 2000s.
The large number of births in the 1950s cohort entered the labor market in the 1970s, ushering in a period of rapid economic growth. But the subsequent drop in the fertility rate meant that the number of new entrants to the labor force ceased to grow beginning from the 1980s and increasingly experienced periods of decline (see Table 1). Hong Kong does not merely have an ageing population situation; it also has an increasingly serious problem of tight labor supply because of the declining numbers of young persons.
Table 1: Ten-Year Change of Population Numbers by Age Group and Sex
| Age group | Sex | 1961-71 | 1971-81 | 1981-91 | 1991-01 | 2001-11 | 2011-21 | 2021-31 |
| 20-29 | M | 84,000 | 272,700 | -66,900 | -56,100 | -14,400 | -55,400 | -36,800 |
| F | 72,800 | 240,700 | 7,900 | -4,600 | 8,000 | -53,700 | -25,100 | |
| 30-39 | M | -9,300 | 129,000 | 209,300 | -14,900 | -108,300 | 4,500 | -59,600 |
| F | -29,000 | 93,300 | 259,800 | 137,900 | -44,600 | 81,100 | -15,600 | |
| 40-49 | M | 64,300 | 36,900 | 71,600 | 241,100 | -67,900 | -70,400 | 6,500 |
| F | 56,900 | 600 | 74,400 | 301,200 | 73,900 | -42,600 | 50,300 | |
| 50-59 | M | 82,700 | 70,100 | 25,200 | 82,100 | 204,000 | -41,500 | -72,000 |
| F | 56,400 | 53,200 | 6,300 | 88,600 | 257,200 | 66,700 | -65,000 |
Note: Figures for 2011-2031 are projections.
During 1961-71 large numbers of 20-29 year old women entered their marriage and childbearing years. In the same period, the number of 30-39 year old women that had completed their childbearing years was in decline. This created an unusually tight labor market just at the time when the textile and garment industries were in ascendance. The result was the innovative emergence of outworkers as a new employment contractual form that allowed women to work at home and be paid by piece rates.
The decline of 20-29 year old women in the population from 1981 to 2011 was significantly less than that of men due to the rise of cross border marriages following China’s opening. This also accounts for the projected surges of 30-39 year old women in 2011-21 and 40-49 year old women in 2021-31. I believe the minimum wage legislation that was enacted in 2010 reflected the political pressure exerted by the labor unions to mobilize these women into the labor force and become their voters.
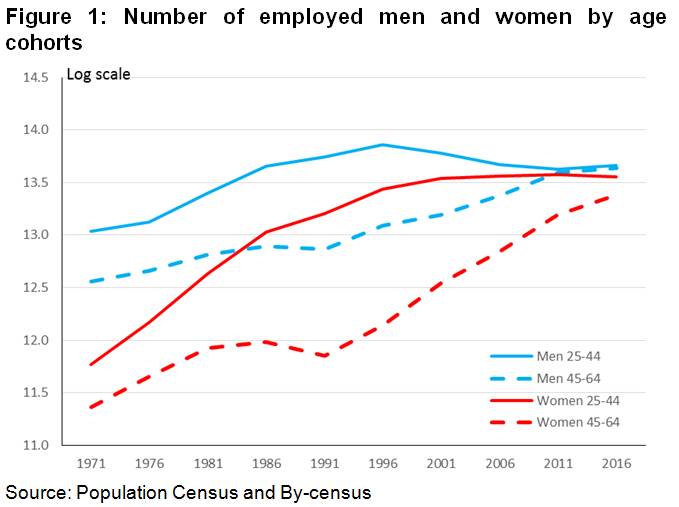
The surges and collapses of population change by age cohort greatly affected the size and composition of the employed workforce. From 1971 to 1996, the number of 25-44 year old employed men and women grew rapidly, especially in the earlier part of that period (see Figure 1). But from 1996 to 2016, the numbers for men declined precipitously and only steadied towards the latter part of the period. For women aged 25-44, their numbers remained steady largely due to rising labor force participation rates and new immigrants through cross-border marriages.
The number of 45-64 year old employed men and women grew rapidly from 1971 to 1996, and continued to increase afterwards but at a somewhat lower rate without experiencing a downturn.
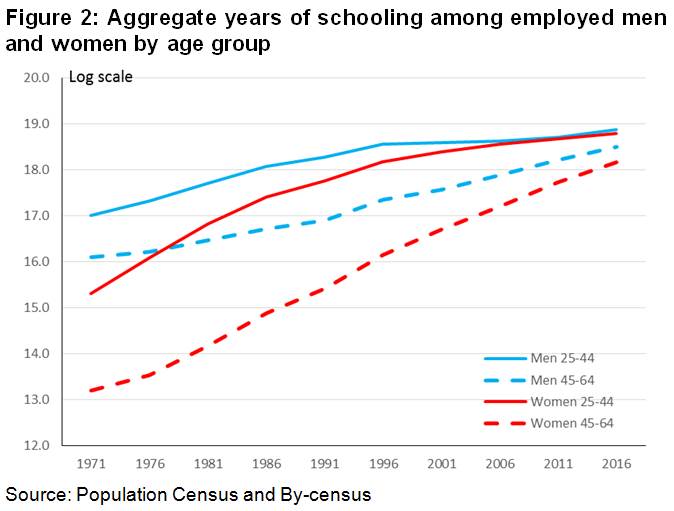
Although the average years of schooling in the population improved as a result of the expansion of education, this did not increase enough to make up for the decline in numbers. From 1971 to 1996, the aggregate years of schooling among employed men and women aged 25-44 years old grew rapidly (see Figure 2). But from 1996 to 2016, the growth slowed dramatically among employed men and more gradually among employed women.
Clearly the slowing and declining numbers of 25-44 year olds in the working population were not sufficiently compensated for by improvements in productivity as measured by more years of schooling. This has been the primary source of slowing economic growth in the past twenty years.
It also explains why Hong Kong’s economic performance has been less successful compared to Singapore, which has aggressively sought to increase the size and education quality of its workforce through investment in education and attracting immigrants.
Historically, Hong Kong’s total factor productivity (which measures the productivity of an economy taking into consideration labor, human capital and physical capital) has been higher than Singapore’s. In the 1970s Hong Kong’s total factor productivity was 7.7% higher than Singapore’s, in the 1980s 13.8% higher, and in the 1990s 46.8% higher, but in the 2000s the gap has narrowed significantly to 5.9%. In the period 2010-14 Hong Kong has actually fallen behind Singapore by 5.7% (see Table 2).
Table 2: Total Factor Productivity in Hong Kong and Singapore
| Hong Kong TFP | Singapore TFP | Ratio of Hong Kong TFP to Singapore TFP | |
| 1960-69 | 0.802 | 0.494 | 1.623 |
| 1970-79 | 0.998 | 0.927 | 1.077 |
| 1980-89 | 1.028 | 0.903 | 1.138 |
| 1990-99 | 1.010 | 0.688 | 1.468 |
| 2000-09 | 0.932 | 0.880 | 1.059 |
| 2010-14 | 0.736 | 0.781 | 0.943 |
The 25-44 year olds are usually the most innovative segment of the entire workforce. Their slow growth in terms of both numbers and human capital endowment is in my view the single most important factor that has slowed down Hong Kong’s GDP and GDP per capita growth in the two decades since the establishment of the Special Administrative Region. It is also one of the reasons behind the increase of economic inequality. The imbalance in human capital distribution is in part a result of the failure of our population and education policies.
This does not rule out the relevance of other factors, but if the problem of human capital investment and its distribution is not remedied, it will be difficult to make any significant improvements to economic growth and inequality. Investing in the young generation is probably the single most important factor on which Hong Kong’s economic future depends, assuming of course that ‘one-country two-systems’ will be in place.


